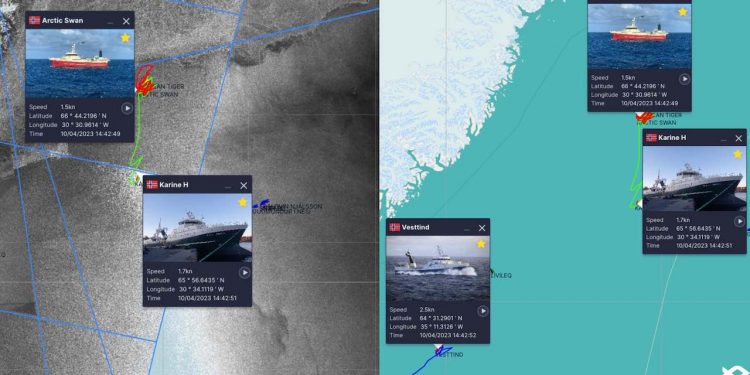
Programmers working at Fishfacts have overcome technical challenges to combine sea satellite ice imagery with AIS data, providing skippers with a new way to track ice coverage for Greenlandic and Canadian waters.
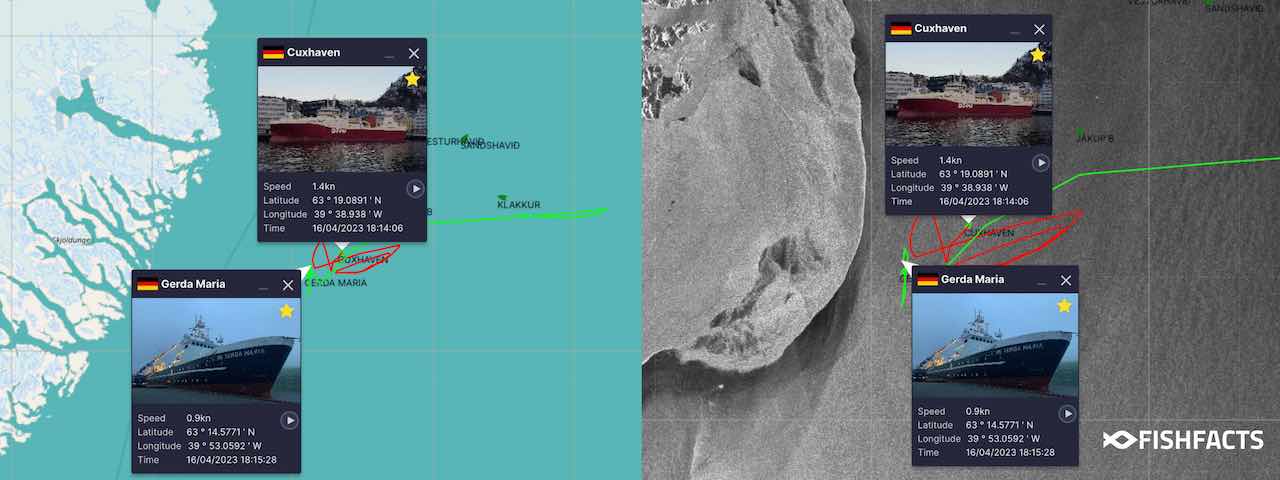
The season for sea ice in this part of the world is from March through to June as rising temperatures cause ice to melt and drift, closing off fishing grounds – and it’s always a challenge to be aware of just how far the ice extends.
‘We work very closely with skippers and shipowners, and they have often asked if we could implement ice charts to our services,’ said Fishfacts co-founder Hanus Samró, explaining that this is easier said that done – and there are good reasons why this hadn’t been done before.
Existing ice cartography had been too expensive, not sufficiently reliable or simply too complex to implement. After looking at the problems around this for some months, Fishfacts decided to develop their own ice charts and to have them ready for this spring’s ice season.

‘This has been the most challenging task that we have faced because not only did we have to combine satellite images of sea ice with our satellite AIS services, but we had to make sure that the images worked on board fishing vessels with poor internet connectivity,’ said Fishfacts founder and CEO Óli Samró.
The Fishfacts programmers overcame technical challenges and released their ice charts on time, having developed sophisticated cartography specifically for fishing vessels operating in Greenland and Atlantic Canada.
Fishfacts uses a variety of satellite image types to deliver a comprehensive, detailed and up-to-date picture of sea ice. Images are updated on a daily basis.
‘We’re first focusing on Canada and Greenland because that’s what we promised our users. However, we will shortly implement satellite images of sea ice for Svaldbard and the Barents Sea,’ Óli Samró added.

